
Part of my weekly schedule is spent on the phone or meeting in person with a variety marketing professionals discussing marketing plans. I have to say, the majority of them -some of them already MGR clients- have also become good friends of mine over the years. However, it amazes me how conservative they are (old fashion if you will) when it comes to their marketing mindset when deciding what’s the best way to invest their marketing budgets.
For that reason, I’ve collected below a variety of actual data and statistics that tell the true story about the direction in which online marketing is moving today and into the next decade. I don’t think you need to be a genius to predict some of this trends, but I’ll let you -the reader- decide if your own marketing is moving in the right direction….
DISPLAY ADS GLOBAL AVERAGE CLICK THROUGH RATE
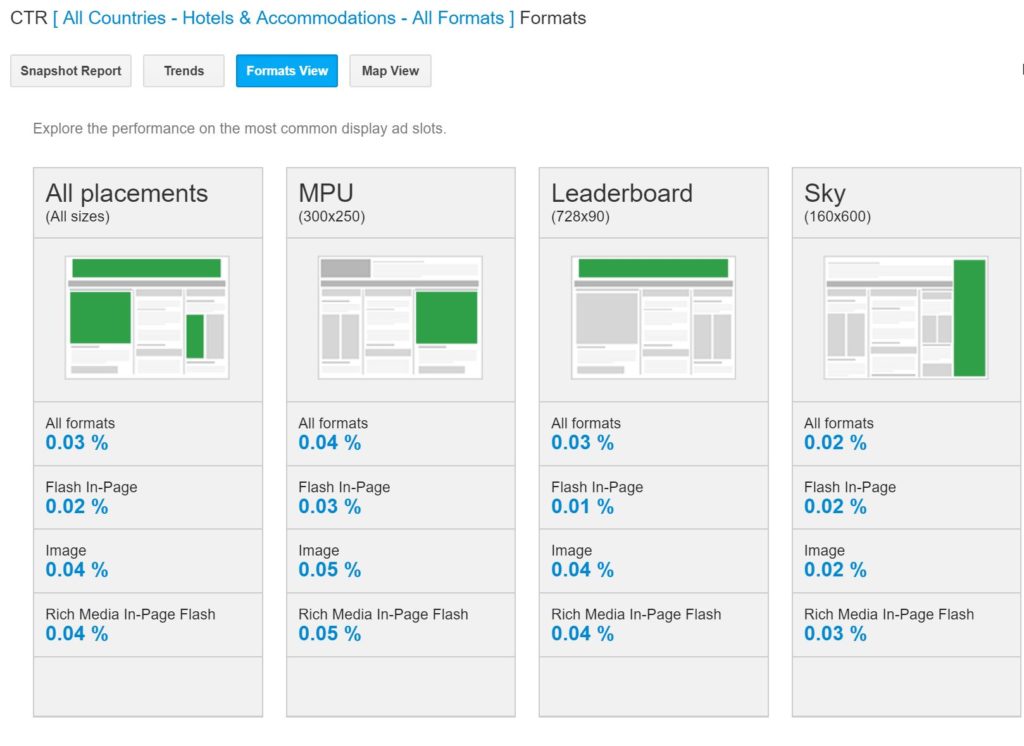
Source: Google Display Benchmarks
What the above means… if your agency is telling you that your banners are getting a 5%-6% CTR, I would seriously question those numbers and ask them for some type of proof. Don’t just take their reports as “proof of purchase.”
THE GROWTH OF ONLINE VIDEO CONSUMPTION
Digital video is booming. Globally, traffic from online videos will constitute over 80% of all consumer internet traffic by 2020 (Cisco),
By 2019, the total U.S. digital video advertising spend is projected to eclipse $14 billion—nearly 50% of that figure ($6.86 billion) is attributed to mobile video.
82% of Twitter users watch video content on Twitter
YouTube, already established as the #2 Search Engine – has over a billion users, almost one-third of total internet users.
45% of people watch more than an hour of Facebook or YouTube videos a week. More than 500 million hours of videos are watched on YouTube each day. More video content is uploaded in 30 days than the major U.S. television networks have created in 30 years.
Social video generates 1200% more shares than text and images combined. Videos up to 2 minutes long get the most engagement. 85% of Facebook videos are watched without sound. Native videos on Facebook have 10 times higher reach compared to YouTube links.
Viewers retain 95% of a message when they watch it in a video compared to 10% when reading it in text. Internet video traffic will be 69% of all global consumer Internet traffic in 2017. By 2019, internet video traffic will account for 80% of all consumer Internet traffic. The average user spends 88% more time on a website with video.
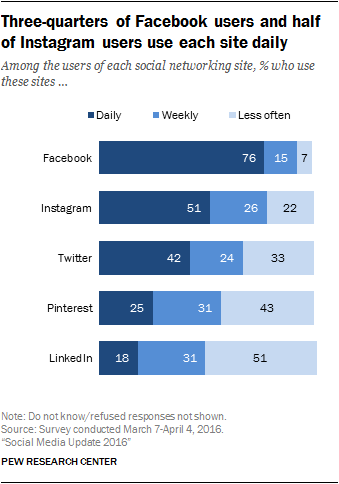
FACEBOOK IS STILL THE KING…
Facebook continues to be the most widely used social media platform, with 79% of American internet users. Based on total population, (not just internet users) 68% of U.S. adults (you know, your customers) use it. What are you waiting for? Start advertising on Facebook already!
76% of Facebook users visited the site daily during 2016, with over 1.6 billion daily visitors, compared to 70% of daily usage in 2015. Almost 80% of time spent on social media platforms happens on mobile.
… BUT INSTAGRAM IS CATCHING UP FAST
In March 2017, over 120 million Instagrammers visited a website, got directions, called, emailed, or direct messaged to learn about a business based on an Instagram ad.
There are over 600 million Instagrammers. Of that 600 million, 400 million are active every day. There are 16,600,000 Google searches for “instagram” per month.
100 million users use the “stories” feature daily. Instagram posts with at least one hashtag average 12.6% more engagement than those without.
IGNORE SNAPCHAT AT YOUR OWN RISK
On any given day, Snapchat reaches 41% of 18 to 34-year-olds in the US. Over 400 million snaps are shared on Snapchat per day, and almost 9,000 photos are shared every second.
Snapchat monthly active users were around 350 Million as of October 2017. Daily active users around 185 million.
Number of daily video views: Around 14 Billion (with a B!). Which explains the average time spent per user each day on Snapchat: About 28 minutes
Advertisers take note. Amount of time users interact with Snap Ads: Over 30 seconds on average.
CONCLUSION
How’s your marketing plan compared to the above data? Are you still worried about meeting that deadline for the print ad that will be placed on page 27 of some magazine that will be found at a dentist office, coffee shop or airport lounge? Think mobile, think video, think voice, think fresh content, and distribute it through the media channels that people are watching today. Otherwise, it’s just a waste of time and money.
Thank you for reading. Until next time, this is Manuel Gil del Real (MGR).
Be sure to subscribe to our new MGR Edge Podcast for the latest trends in consumer online habits and how they are influencing the way companies are planning their current marketing strategies.