In a previous article, I’ve already established the importance of including VideoMarketing and YouTube as part of your Social Media Marketing and Search EngineOptimization efforts.Today, I will briefly review how you can track your Video Marketing results through YouTube’s Analytics Reports.
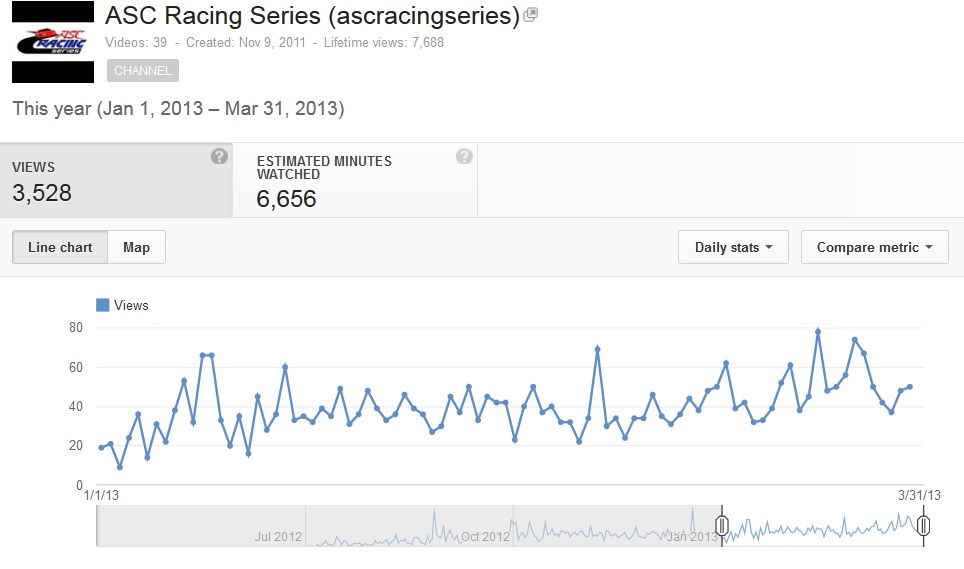
Once you have your YouTube Channel created, you can just go to the “Video Manager” page and click on the “ANALYTICS” link on the left side menu.That will open a page with all the viewership information and statistics about your videos.For this particular example, I’m using a screen shot example of my own ASC Racing Series YouTube Channel.
By selecting the “Views” section from the dashboard – as shown in the image above, you can just use the slider bar with a date range above it to customize your report date range. Once you are able to change dates, you can pin-point how traffic increased as a result of a particular campaign or any other marketing effort that was sending viewers to your YouTube channel.The rest of the report metrics will also adjust automatically to the date range selected.
For example, by selecting “Demographics” on the left menu, you can also see the type of audience that is watching your videos.Based on the screen shot below, It looks like my racing videos are only watched by men! It looks like the ladies don’t care much about racing videos.
Measuring Traffic Sources
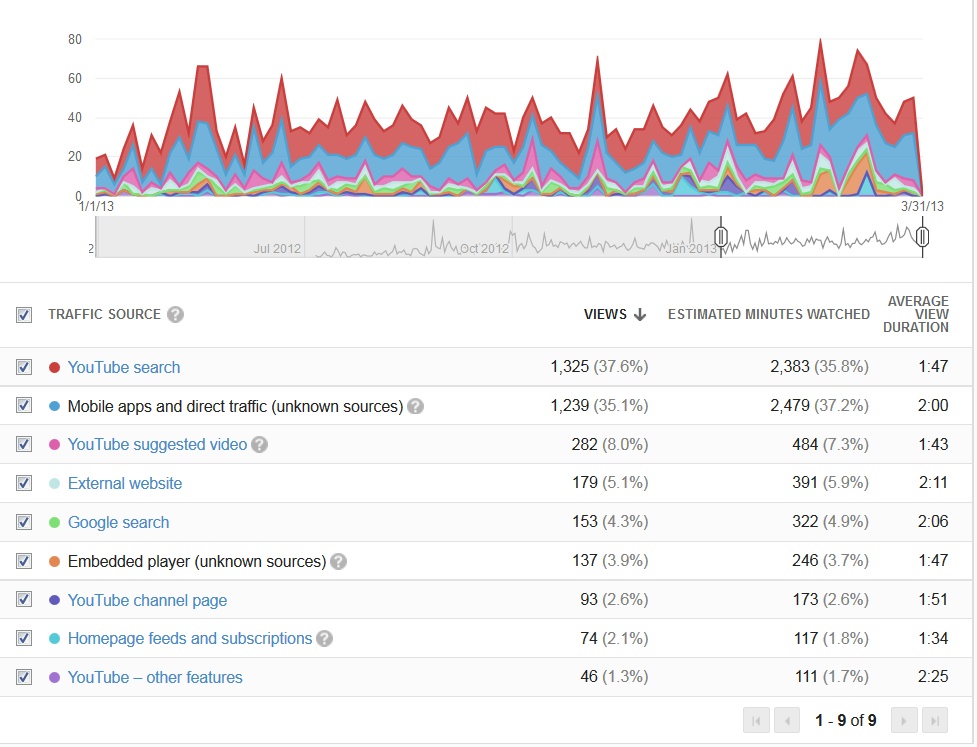
For me though, the most useful information is to know Traffic Sources, in other words, where my video viewership traffic is coming from.To go to that metric, select the “Traffic Sources” link from the left menu and you will see a screen similar to the one below.
Of course, when you mouse over each of the sections of the chart above, YouTube will display statistical information for each particular date via small pop-up.But for now, we will just cover briefly what each color and description really means.
Here’s a breakdown of the different traffic sources and what they mean:
·YouTube Search:This basically means that these viewers found your videos through YouTube while using it as a Search Engine.
·Mobile apps and direct traffic:This is a compilation of what YouTube calls “Unknown Sources” but in reality it is similar to the above YouTube Search, except that in this case the search came from a variety of mobile device apps.Also Views of unknown referrer on mobile apps and direct traffic on the YouTube watch and channel pages. Possible origins of direct traffic include email and instant messaging clients or copying and pasting a URL into the browser.
·YouTube Suggested Video: These are views from thumbnails appearing on the side of the page of other videos or on the end screen of a video.
·External Website: the video was either embedded or linked to from an external website.
·Google Search: Video linked to as a result of a Google Search
·Embedded Player Unknown Sources: In this case, Referring pages for videos embedded on other websites are unknown. However, you can see which sites are embedding your videos in the playback locations report for an individual video.
·YouTube Channel Page: These are views from visitors that are watching videos directly from your Channel page.
·Homepage Feeds and Subscriptions: Views from the various feeds on the YouTube homepage and subscription features
·YouTube Other Features: These are typically internal views more likely from the Channel owner while posting the videos, checking playback features, quality, etc.
Measuring Audience Retention
Finally, another important metric is what is called “Audience Retention.”This metric basically tells us how long do viewers remain watching the videos, in other words, whether they watch the entire video or just a portion of it. That said, don’t expect to see a 100% retention anytime.Viewer “drop off” occurs more often than not.That also doesn’t mean that your audience is not watching the entire video.It could be that they are watching portions of the video at different times.It could also mean that they are ‘skipping’ to other sections of the video.However, this metric is always a good indication of how long your videos should be for maximum viewership.
The screen shot below shows that the average view duration on this particular channel is just under 2 minutes.Most of the videos posted are about 6-8 minutes long, thus the 21% Audience Retention number.
The key element to keep in mind is that the first minute of every video is critical as it will determine whether your viewer decides to stick around to view more or stop it and look for something else.If you’re selling a product or a service, be sure to include your most important information upfront and a call to action throughout the video to maximize your video marketing effectiveness.
I hope this clarifies a bit how YouTube Analytics works and how to understand the different metrics.If you have any questions, please use the comments section to drop me a line.
Until next time, this is Manuel Gil del Real (MGR)
Manuel Gil Del Real is the owner of MGR Consulting Group, an Interactive Marketing Agency providing marketing solutions to companies worldwide. He’s also an auto racing enthusiast and a blog author who enjoys sharing his thoughts and ideas on eCommerce, SEO, Social Media, Website Design, Video Marketing Internet Marketing, entrepreneurial advice, lifestyle and travel experiences among many others.