

Sharpening your marketing tools should be an ongoing process and not the type of task that you simply look into once a year. If something doesn’t work, or if a campaign is not generating the type of ROI that you had planned for, the sooner you look into it, the better. Adjusting, fine-tuning, testing, measuring, testing again, refining, rinse and repeat. Sounds like fun, right?
Hubspot recently released their annual Demand Generation Marketing Survey Report for 2017. This is always an interesting read for me for a couple of reasons: I love marketing data and I like to see how it relates to different industries. (Hubspot surveyed 350+ companies for this report)
I highly recommend the report to anyone involved in online marketing, no matter the industry. What you’re going to read below is just a quick synopsis with some overall numbers for ALL industries. To view the complete report, please visit Hubspot.com
Key Numbers:
- The average cost per lead is just under $200.
- Email campaigns achieve on average a 17% open rate and 4% click-through rate.
- Organizations on average are generating over 470,000 website visitors, 1,800 leads and 300 new customers per month.
- Organizations with revenues under $500 million have a mean cost per lead of roughly $180; companies with revenues above $500 million spend more than double that, at roughly $430 per lead.
Key Takeaways:
- Growth Plateaus for larger companies – Smaller organizations are more likely to be exceeding their revenue expectations, while larger organizations seemed more likely to achieve, but not exceed, their revenue goals. While plateaued growth isn’t rare for enterprise companies, that does not mean it has to be the gold standard for those willing to re-evaluate their sales and marketing strategies.
- Cost per lead is higher for larger companies – The largest organizations (1,001 + employees) are able to generate greater web traffic, more leads and more customers per month, but also pay a significantly higher price per lead. We suspect much of this is because larger organization are also using more outbound tactics than those paying less for leads.
- Leads are crucial for revenue attainment – Organizations that fail to meet their revenue goals tend to generate fewer leads and sales opportunities in spite of having similar website traffic to more successful organizations. Open rate and click-through rate for email campaigns are also significantly lower for organizations not meeting revenue goals.
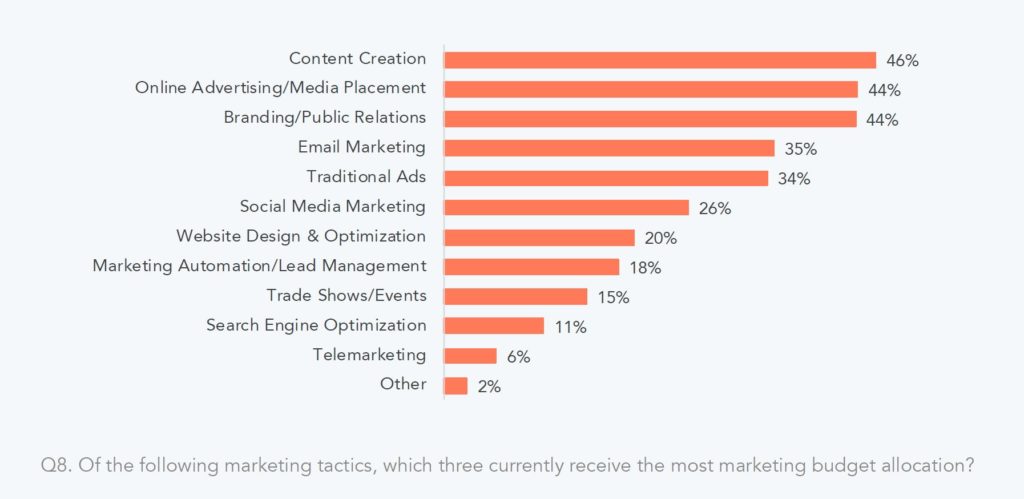
- Content yields success – Organizations exceeding their revenue goals are more likely to use content creation, online advertising and branding/public relations marketing tactics, with content creation leading the pack by a substantial lead.
Marketing Channels

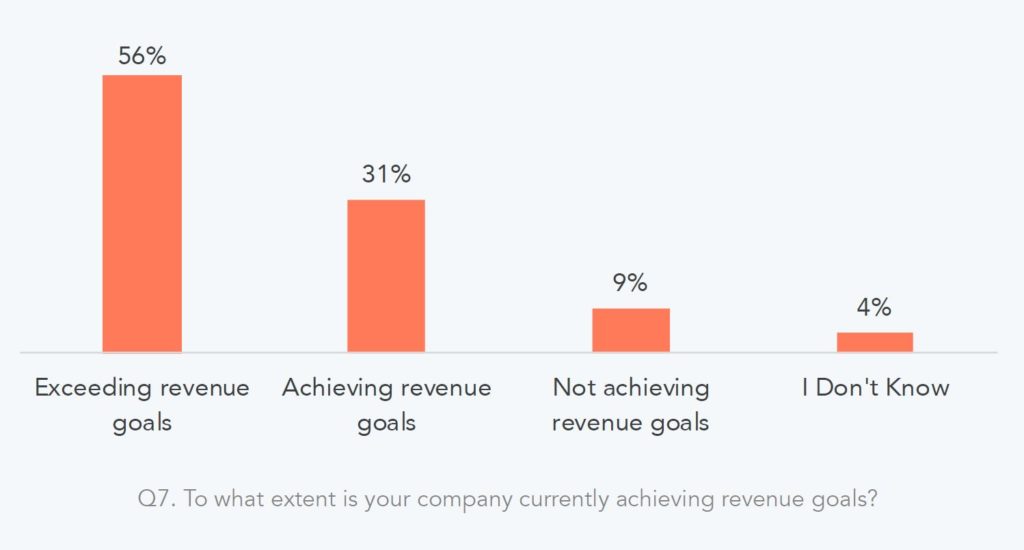
Achieving Revenue Goals
We were pleased to find that half of those surveyed say that their organization is exceeding revenue goals, while only one in ten organizations are failing to achieve their revenue goals. 31% of respondents were achieving, but not exceeding their revenue goals. For this segment of businesses, accelerating growth may take some shifts in their demand generation strategy.

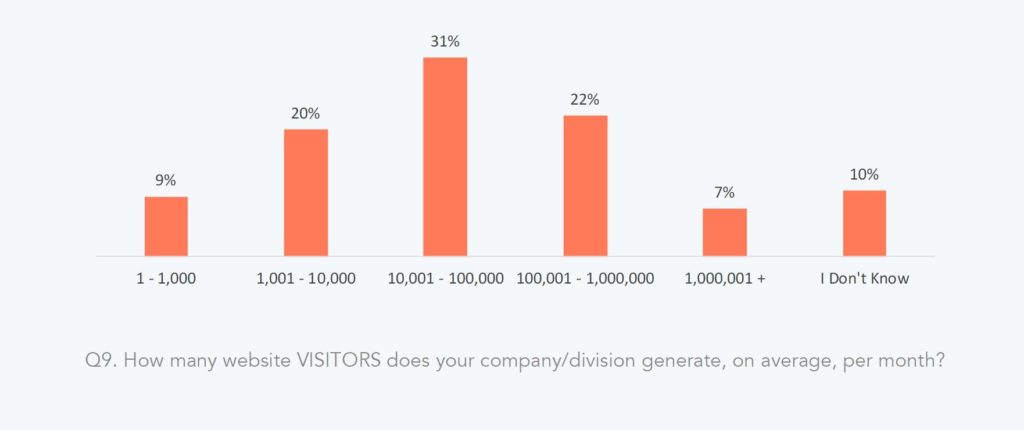
Website Visitors Per Month
The mean average of website visitors per month across organizations surveyed is 470,776. Fewer than one in ten organizations receive more than a million visitors per month.

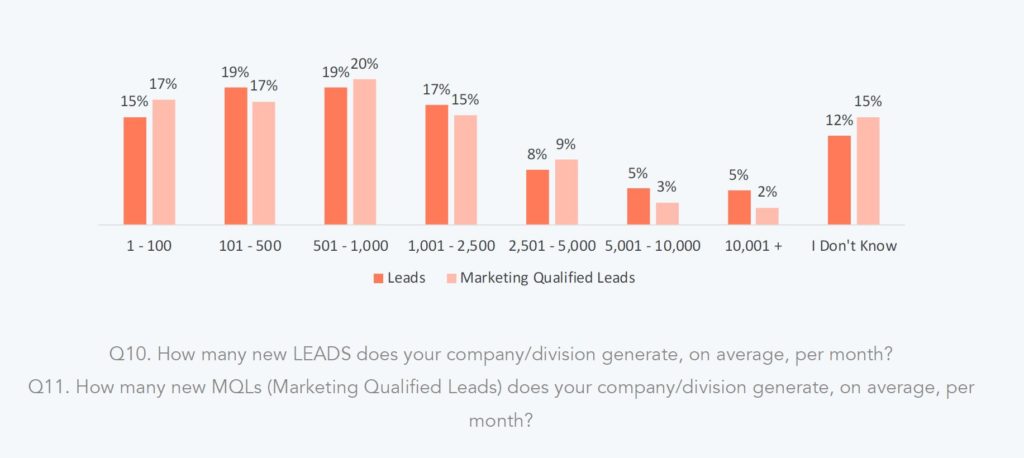
Leads Generated Per Month
On average, organizations generate 1,877 leads per month and 1523 MQLs (Marketing Qualified leads). Just over one in ten are unable to say how many leads they generate in a given month.

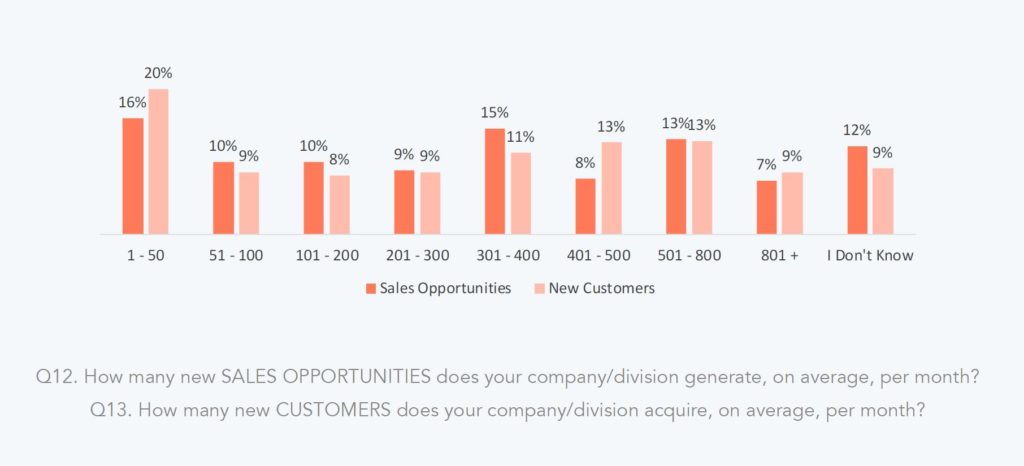
Sales Opportunities and New Customers Generated Per Month
From those leads, contacts sources by sales, and other means, organizations generate an average of 312 sales opportunities and 318 new customers per month. One explanation for the fact that the number of opportunities is less than the number of customers for some companies, could be that several business models are based on touchless sales.

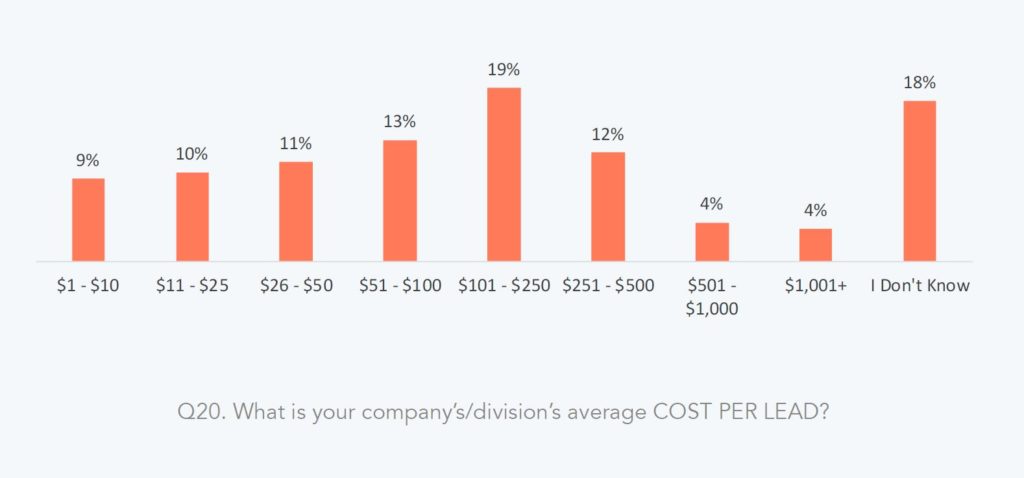
Cost Per Lead
The mean cost per lead across organizations is $198.44, with some organizations shelling out over $1000. Two in ten companies admitted they were unaware of what their organization spends to generate the average lead.

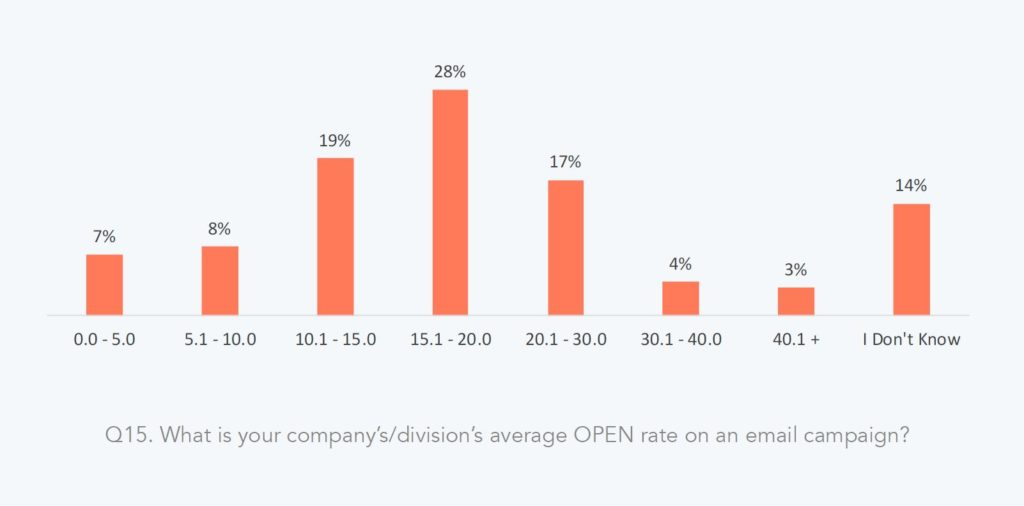
Open Rate on Email Campaigns
The mean average open rate for email campaigns is 17% and over 50% of marketers see open rates below 20% on average. Only a small number of organizations (3%) are able to achieve open rates above 40%, and a sizeable number of companies (14%) didn’t have a grasp on their performance.

Click-Through Rate on Email Campaigns
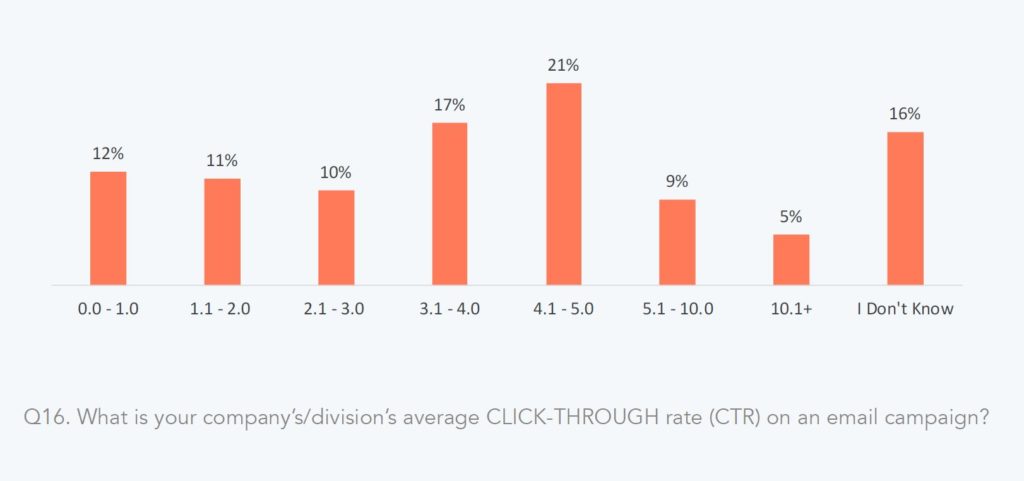

Respondents revealed that the average click-through rate for an email campaigns is only 4%. More so than with open-rate, 16% of marketers said they did not know the click-through performance of their emails. With the reliance that most marketers have on email for communication, it’s troubling to think that over 80% of communication is falling on deaf ears for most companies. Teams that aren’t focusing on increasing email performance, while also exploring other communication channels like social and chat stand to lose a lot in the coming years.
Thank you for reading. Until next time, this is Manuel Gil del Real (MGR)
Source: Hubspot.com